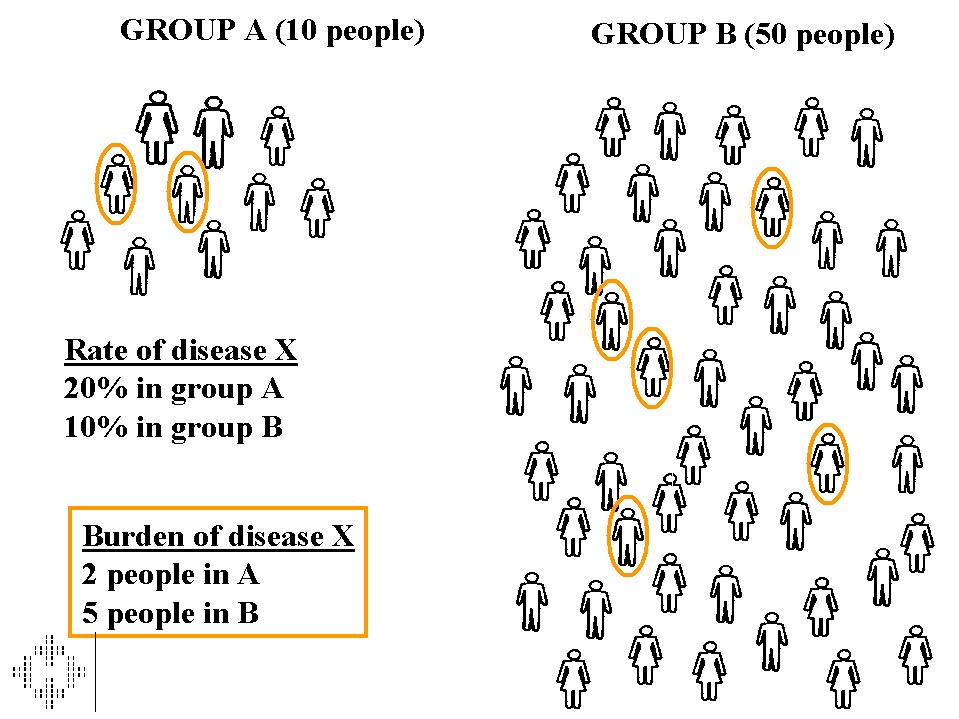
There are two ways to look at the impact of a condition on a population. Let’s say we had two groups of people - A and B. In group A, 2 people had Disease X. In group B, 5 people had disease X.
1. From one point of view, the “burden” of disease is greater in group B, that is, more people are going to walk through the door of a clinic for help with Disease X.
2. From another point of view, the risk of an individual having disease X is much greater in Group A; the percentage of people with Disease X is 20% (2/10) in Group A but only 10% (5/50) in Group B.
A practical example: Diabetes
Let's compare the RFN people living in Central RHA (about 3000) to Burntwood (about 13,000); the diabetes rate (i.e. the risk per person) for RFN in Central is higher than in Burntwood (23% vs. 17% [age-adjusted] or 16% vs. 12% [crude]), whereas the burden is higher in Burntwood (lower rate, but more people, so more actual numbers of people with diabetes).
Much of the results presented in our research focus on rates (like the percentages above) - the risk of a person getting a disease, or the rate of a person seeing a doctor, etc... Both viewpoints are important; though we focus on rates, remember, a rate can easily be turned back into the actual “number” by simply multiplying by the size of the population.