Max Rady College of Medicine
Concept: Gini Coefficient
Concept Description
Last Updated: 2010-10-28
Introduction
-
Inequality of wealth can be described as a small fraction of the population having all or a large fraction of the total wealth, or, equivalently, a large percentage of the population having none or a small percentage of total wealth. Statements such as,
"The bottom 80% of households have 20% of the total wealth"
attempt to quantify the level of inequality by relating the population of the poorest X% of households with the Y% of total wealth they have.
The Gini coefficient is a measure of disparity in a population. It is the ratio of the area between the line of equality and the Lorenz curve divided by the total area either above or below (depending on the curve of the Lorenz Curve) the line of equality.
The Lorenz Curve
-
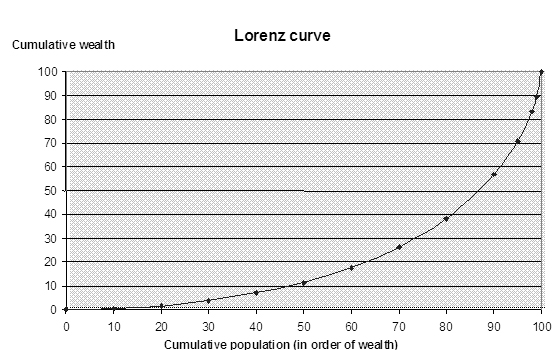
The Lorenz curve (
Lorenz, 1905
) plots the cumulative proportion of wealth by cumulative proportion of population, ordered by increasing wealth.
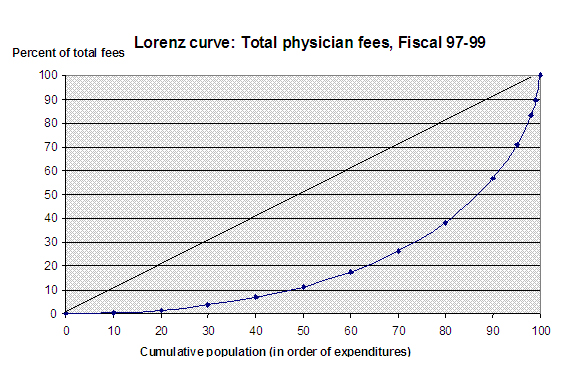
The origin of the Lorenz curve comes from economic theory, and it is usually used to describe distributions of wealth or income. But anything that varies among members of a population, such as health care expenditures, can be subjected to the same analysis. The degree to which some people are heavier users of the health care system than others can be summarized with a Lorenz curve, and the resulting curves for different cost components (hospital, physician, drugs, etc.) can be compared.
The following example Lorenz Curve is based on the distribution of total physician fees over three years in Manitoba. It shows, for example, that the lowest 50% of the population generates just over 10% of the total fees.
Perfect Equality
If everyone had the same level of expenditures, then X% of the population would generate X% of the total fees - in other words, the Lorenz curve would fall along the diagonal line shown in the above graph. This line is called the line of perfect equality. The degree of inequality in a population is shown by how far the Lorenz curve appears above or drops below the line of perfect equality.
The Gini Coefficient
-
The distance between the Lorenz curve and the line of perfect equality changes along the length of the curve, so what is needed is a single number which summarizes the behaviour of the entire curve. One way to get such a number is to measure the area between the line of perfect equality and the Lorenz curve: the larger the area, the greater the inequality.
Gini (1955) expresses this area as the fraction of the total area under the line of perfect equality. The calculated Gini coefficient can take on a value from 0 to 1. A Gini coefficient equal to 0 indicates that there is zero disparity in the population such as in the case where there is perfect equality. A Gini coefficient equal to one indicates that there is perfect inequality in the population. A general rule is that the closer the Gini is to zero the less disparity there is between the neighbourhood income quintile groups and hence the overall population.
A formula for calculating a Gini coefficient is as follows (adapted from Gini, 1955):
GINI = abs(A-B), where:
A = sum[X(i) * Y(i+1)]NOTE: To obtain confidence intervals for the GINI perform bootstrapping (see More Information section below for a link to an article describing the bootstrapping method).
B = sum[X(i+1) * Y(i)]
X = proportion of income in the population
Y = proportion of events in the population, and
X(i+1) = lag(X(i))
Y(i+1) = lag(Y(i))
Example of the Gini Coefficient
-
An example of the calculation for the Gini Coefficient for premature mortality from the
Health Inequities
deliverable
(Martens et al., 2010)
is presented in the following link:
Example of the Gini Coefficient Calculation
.
MORE INFORMATION
-
Castillo-Salgado C, Schneider C, Loyola E, Mujica O, Roca A, & Yerg T. (2001).
Measuring Health Inequalities: Gini Coefficient and Concentration Index,
Epidemiological Bulletin, 22(1), Pan American Health Organization. [
full text
]
-
Dixon, P. M., Weiner, J., Mitchell-Olds, T., & Woodley, R. (1987).
Bootstrapping the Gini Coefficient of Inequality.
Ecology, 68, pp. 1548-1551. [
full text
] (Note: See next reference for a correction to this paper)
- Dixon, P. M., Weiner, J., Mitchell-Olds, T., & Woodley, R. (1988). Erratum to Bootstrapping the Gini Coefficient of Inequality. Ecology, 69. pp. 1307.
SAS code and formats
Related concepts
Related terms
References
- Deber RB, Forget E, Walld R, Roos LL. Designing drug benefit plans: How are pharmaceutical costs distributed in the population? (Presented at the 1st Conference of the Canadian Association for Health Services and Policy Research, Montreal QC, May 26-28, 2004)(View)
- Gini C. Variabilite Mutabilita, 1912. In: Pizetti, E, et. al. (eds). Rome, IT: Libreria Eredi Virgilio Veschi; 1955.(View)
- Lorenz MC. Methods of measuring the concentration of wealth. Journal of the American Statistical Association 1905;9(70):209-219.(View)
- Martens P, Brownell M, Au W, MacWiliam L, Prior H, Schultz J, Guenette W, Elliott L, Buchan S, Anderson M, Caetano P, Metge C, Santos R, Serwonka K. Health Inequities in Manitoba: Is the Socioeconomic Gap in Health Widening or Narrowing Over Time? Winnipeg, MB: Manitoba Centre for Health Policy, 2010. [Report] [Summary] [Updates and Errata] [Additional Materials] (View)
Keywords
- inequality
- physician fees
- statistics
Request information in an accessible format
If you require access to our resources in a different format, please contact us:
- by phone at 204-789-3819
- by email at info@cpe.umanitoba.ca
We strive to provide accommodations upon request in a reasonable timeframe.
Contact us
Manitoba Centre for Health Policy
Rady Faculty of Health Sciences,
Room 408-727 McDermot Ave.
University of Manitoba
Winnipeg, MB R3E 3P5 Canada
204-789-3819