Max Rady College of Medicine
Concept: Variance
Concept Description
Last Updated: 2000-07-10
Introduction
-
Variance
is a technique used in statistical analysis to calculate the degree of variance of collected data. The most logical reference point in data analysis is the mean, notated as
 , the typical value for a set of data. Writing
then is an indication of how much each individual value of x varies from the average. If this is done for each value and added, the result is the total variance,

One expects this value to be large if the variation is large, and vice-versa; unfortunately, totaling these differences of deviation is a meaningless calculation. Those individuals having values greater than the average [( x -
) > 0] will cancel out those values less than the average [(
x
-
) < 0], as the average is, by definition, a typical value, constant in both scenarios. The calculation that is of use, however, is known as the sum of squares, or the sum of squared deviations of
x
from the mean:
In this case, the larger the amount of variation in a set of data, the larger the value of the sum of squares. This method does, however, have some limitations as a universal measure of variation. A study based on 100 results is likely to result in a larger sum of squares than a study based on 10 results simply because it will result in the totaling of far more squared differences, thus helping to eliminate the effects of random error. To allow for fair comparisons between studies of different sizes, and to provide a truly universal measure of variation, it seems reasonable to take the study size into account by calculating an average variation. This measure of variation, the variance, is calculated as:

where n is the sample size, or total number of x values.
The reason for which the value of one less the sample size is used to "average out" the variation is known as degrees of freedom. This consideration helps to correct for the error introduced in calculations with the assumption of the sample average to be the same as the average of the true population. When the sample is allowed to define its own reference point (as must be done), the results will seem slightly more impressive (less variable) than they actually are.
If the sum of squares, then, is smaller than it actually should be, the balance could be restored by dividing it by a value that is smaller than might be expected. Ultimately, the division by ( n - 1), rather than by n , is exactly what is needed. This seems to suggest that one of the results is missing, or at least redundant, and that is, indeed, what has happened. Once a data set is used to create its own reference point (by calculating the sample mean) any one of the individual results can be lost or destroyed without compromising the study at all.
Consider a hypothetical blood pressure study in which 10 diastolic blood pressures are measured. The sample average is calculated to be 90 mm Hg. Sometime later one of the patient records is accidentally destroyed and is lost forever. The study, however, has not been at all damaged. The remaining nine blood pressures are as follows:
84 112 71 85 82 99 102 92 94
These add up to 821. Because the original 10 results must have totaled 900 (the only way to divide by 10 and achieve an average result of 90) the apparently lost result must be 79. Once the data is used to establish the sample mean, only ( n - 1) of the original observations are actually needed to describe the study situation in complete detail. This value, the number of truly independent items of information in a set of data, is usually referred to as the set's degrees of freedom.
The degrees of freedom are a reminder that there is always a price to be paid in calculations: if 10 items of data are collected and used once by necessity to establish the sample mean, then there are only 9 genuinely meaningful facts left to use, not 10.
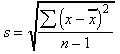
To conclude the topic of variance, this technique has one major drawback as a truly useful measure of variation. It is based on squared differences (to avoid the differences simply canceling out one another), and it therefore measures variation in squared units. It is difficult to relate to squared units of measurement; fortunately, the solution to this problem is very simple. Taking the square root of the variance will transform the variation measurements into sensible units once again. This most meaningful and most widely used measure of variance is called standard deviation, s , expressed as:
Clearly, the standard deviation measures the average amount of variation (as defined by differences or deviations from the mean or typical value) present in a set of data. There is an alternate method of calculating such an average, although this technique proves to be inadequate.
The problem of the positive and negative differences that cancel out one another could also be solved, not by squaring them, but by simply ignoring their signs. This is a perfectly respectable mathematical strategy known as taking an absolute value; it is denoted by:

The signs having been ignored, the deviations could simply be added and averaged, with none of the problems of having to first square them and then find the square root of the final average:

This measure is known as the mean deviation. As the name suggests, it too yields a measure of the average variation in a set of results, similar to that of standard deviation. However, it is revealed that the standard deviation offers the potential to achieve a very detailed understanding of a data set and the lessons it might have to offer us. By contrast, the mean deviation makes a statement about average variation and nothing more. As a result, the standard deviation has become the standard measure of variability, and the simpler mean deviation has become nothing more than a biostatistics footnote.
Related concepts
Related terms
References
- Hassard T. Understanding Biostatistics. 3rd ed. St. Louis, MI: Mosby-Year Book, Inc. 1991.(View)
- Kraut A, Mustard C, Walld R, Tate R. Unemployment and health care utilization. Scand J Work Environ Health 2000;26(2):169-177. [Abstract] (View)
Keywords
- statistics
Request information in an accessible format
If you require access to our resources in a different format, please contact us:
- by phone at 204-789-3819
- by email at info@cpe.umanitoba.ca
We strive to provide accommodations upon request in a reasonable timeframe.
Contact us
Manitoba Centre for Health Policy
Rady Faculty of Health Sciences,
Room 408-727 McDermot Ave.
University of Manitoba
Winnipeg, MB R3E 3P5 Canada
204-789-3819