Max Rady College of Medicine
Concept: Housing Variable - Winnipeg
Concept Description
Last Updated: 2002-11-05
Introduction
-
The housing variable derives from housing data supplied by the City of Winnipeg Community Services Department, as part of the Neighbourhood Designation report (March 2000). Eight SAS datasets were created from portions of the original files from the City of Winnipeg:
-
Demolition
- number of demolition orders
-
Effectage
- Effective age of residential dwellings (takes into account major renovations)
-
Occorders
- Occupancy Orders (closures or partial closures of dwellings)
-
Placards
- similar to Occupancy Orders
-
Permits
- the number of building permits issued
-
Rentals
- the number of residential rentals (not including apartment buildings)
-
Rooming
- the number of rooming houses in the neighbourhood
- Sellprice - the median selling price of residential dwellings in a neighbourhood
Each of these files has a record for each of the 228 neighbourhoods in Winnipeg. There are several neighbourhoods, however, that have very little information because they are not residential (e.g., Assiniboine Park, Legislature, Inkster Industrial Park, Pembina Strip, Airport, etc.).
Geographic Aggregation
-
The neighbourhoods can be easily incorporated into the 23 Neighbourhood Clusters (see section in
Winnipeg Area Definitions
concept), which are comprised of the 228 neighbourhoods. There are only 23, as opposed to the 25 areas for the Winnipeg Regional Health Authority (WRHA), because East and West St. Paul are not included (they are not part of the City of Winnipeg although they are part of the WRHA). These 228 neighbourhoods can also be aggregated into the 12 Community Areas (see
Winnipeg Area Definitions
concept) (with the caveat that East and West St. Paul data are not included in the River East and Seven Oaks CA's respectively).
The 228 neighbourhoods can also be aggregated upwards to the 72 Community Centre Areas (CCA's) with only minor discrepancies. Eighty-five neighbourhoods (37.3%) fall exclusively within a single CCA, or greater than 99% of their area is within a single CCA. An additional 61 neighbourhoods (26.8%) have greater than 90% within a single CCA. For the largest portion of each neighbourhood, the average proportion within a single CCA is .887, and the median is .975.
Only 27 neighbourhoods (11.8%) have less than .60 of their area within a single CCA, and several of these do not contribute towards the data because they are not applicable and do not contain information necessary for several of the housing variables (Airport, CPR Yards, commercial areas such as Pembina Strip, etc.).
Other geographic aggregations may be more difficult as this data is reported at the neighbourhood level. These boundaries may not correspond perfectly with other boundaries.
Principal Component Analyses
-
Principal component analyses look for the commonalities amongst the variables that are included. They may be used to determine whether a single underlying construct is determining the scores on all the variables, or if the variables can be considered truly independent of one another.
Principal component analyses have been conducted on the housing variable to determine whether the various measures diverge in their estimate of the city areas, or provided similar accounts of the city areas. All of these analyses treated each neighbourhood equally when data was aggregated upwards. For the Neighbourhood Clusters and Community Areas, all housing measures provided essentially the same estimates of the areas, except for "building permits", which differed considerably.
For the Community Areas the proportion of variance accounted for by the first principal component is .86, and for the Neighbourhood Clusters the proportion of variance accounted for is .75. Therefore, if one is not interested in the number of building permits issued, a single housing score comprised of the other measures can be used for the NC's and CA's, or optionally one can also include the number of building permits issued as a separate variable in any analysis. A principal components analysis on the data for the 72 Community Centre Areas indicated that all measures provided essentially the same estimates of the areas except for building permits, and median selling value. Therefore, principal components scores are based on all measures except those two (R2 = .70).
See Housing Variable SAS Code below for more information.
To get an idea of the distribution of housing conditions in the City of Winnipeg, the principal component scores for the 12 CA's and 23 NC's are presented in table 1 . Figure 1 displays the distribution for the Community Centre Area level.
As an indication of how the housing measures may correspond with other indicators, correlation matrices for the housing scores, premature mortality rates (PMR), ADG25 rates (a clinical grouper encompassing substance abuse diagnoses and many psychiatric diagnoses) and SEFI scores (socio-economic factor index) are also presented (see Table 2 , Table 3 , and Table 4 ).
Several variables have been mapped to illustrate their distribution in Winnipeg:
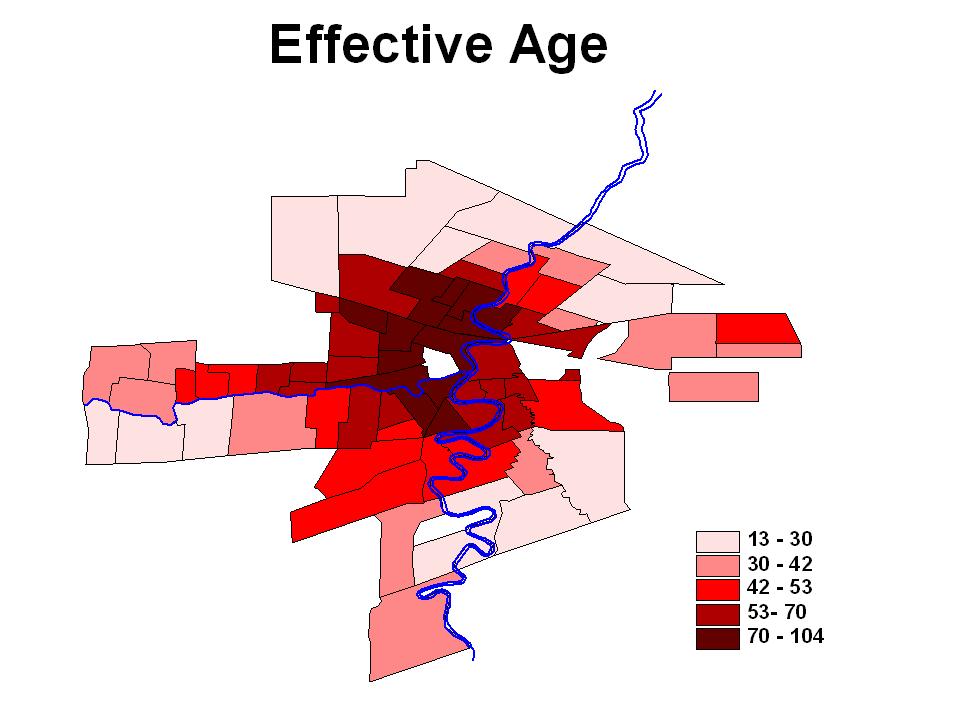
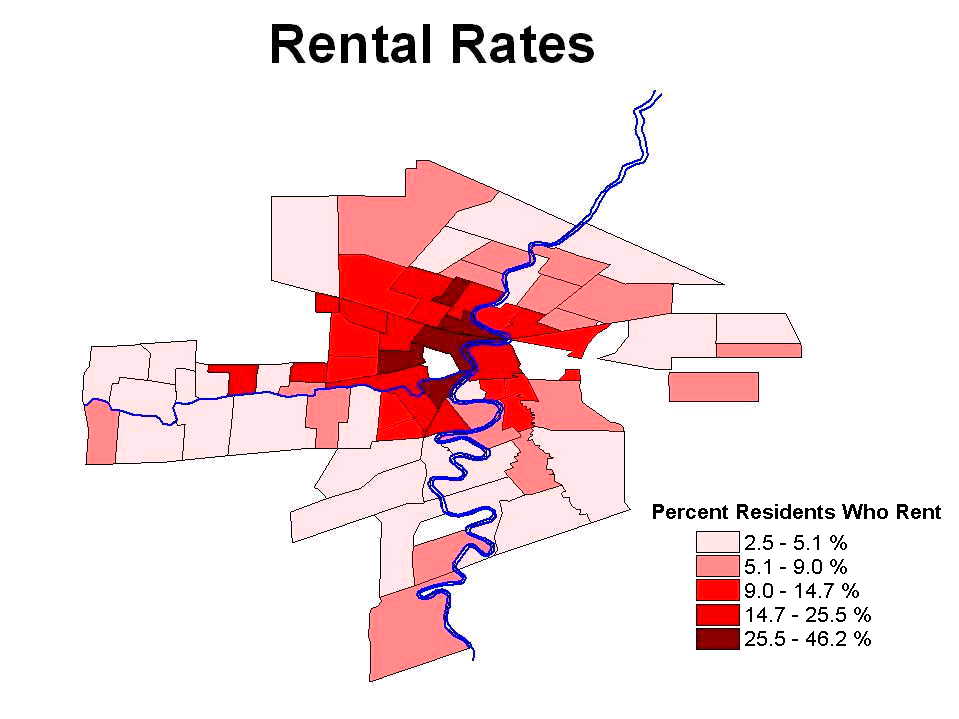
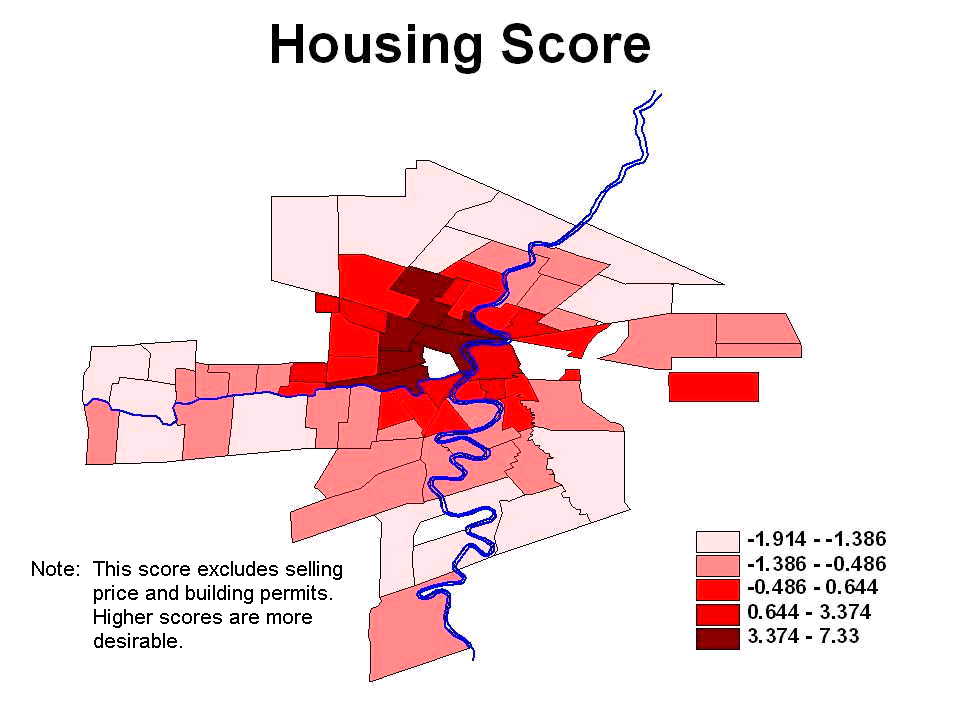
Weighting the Data
-
Since the data is calculated at the neighbourhood level, one can treat each neighbourhood as equal simply by using the raw data, although this can be somewhat complicated. Some files give raw numbers (e.g., Demolition, Placards) while others only provide averages (e.g., Effectage, Sellprice).
-
To weight some of this data according to population in the neighbourhoods, the census can be used to calculate the population for the various neighbourhoods.
-
To weight this data according to the number of homes in the neighbourhood, rather than the number of people, the Rentals file and the Rooming file contain a field that indicates the number of residential homes in the neighbourhood.
- Note: This does not include apartment buildings, as these are not considered residential "homes"?.
As of this writing we are looking into acquiring the total number of dwellings (homes and apartments) for CA's, NC's and CCA's.
Related concepts
Related terms
- Community Resources Databases
- Effective Age of Houses
- Habitable Housing Units
- Household
- Housing Unit
- Housing Unit - Major Renovation
- Housing Unit - Minor Renovation
- Housing Units - Replacement
- Rental Houses
- Selling Price of Houses-Median
- Social Housing - City of Winnipeg Data
- Total Housing Units
Request information in an accessible format
If you require access to our resources in a different format, please contact us:
- by phone at 204-789-3819
- by email at info@cpe.umanitoba.ca
We strive to provide accommodations upon request in a reasonable timeframe.
Contact us
Manitoba Centre for Health Policy
Rady Faculty of Health Sciences,
Room 408-727 McDermot Ave.
University of Manitoba
Winnipeg, MB R3E 3P5 Canada
204-789-3819