Max Rady College of Medicine
Concept: Family Income / Household Income - Extracting from DPIN Application Files
Concept Description
Last Updated: 2023-04-03
Introduction
-
Household income is a strong indicator of socio-economic status and is correlated with measures of overall health. When comparing the health of groups which differ across socio-economic status, it is important to adjust for that difference by techniques such as subgroup analysis or regression modelling. Ideally, one would want a measure of income for each household represented in the study. This is typically not available from administrative data.
Sources for such micro-level data are difficult to come by, however. Even in the 2001 Canadian Census, 23% of respondents ages 15 and older withheld some part of their income information, with 12.4% providing no data at all to Statistics Canada . Smaller surveys may have a better response rate, but usually only cover a very small fraction of the population. Linkage with the NPHS and CCHS surveys requires special permission. Furthermore, privacy concerns prevent the linkage of individual-level Census data.
Area-level income from aggregated Census data (generally at the enumeration area or dissemination area level) has often been used, but is sometimes criticized on the basis of the ecological fallacy, (bias resulting from the assumption that all members of a group exhibit characteristics of the group at large) Robinson, 1950 .
Reviewers often assume that any study using aggregate data is prone to the ecological fallacy, and therefore the results are suspect, at best. Hammond, 1973 , however, discusses aggregation bias as a form of specification error, and provides methods to assess whether individual-level inferences are warranted. Often Manitoba based studies are improved by the inclusion of individual household income data for a subsample, even when the population analysis uses aggregated Census data Roos et al., 2005 .
Significance
-
One previously unexplored source of household income is the Drug Program Information Network (DPIN) Client Applications File (see the
Drug Program Information Network (DPIN) Data
glossary term for more information). Starting March 1996, anyone wanting to claim Pharmacare must submit an application. Required on the application is the applicant's (and any spouse's) income. The sum of these, adjusted for dependents, is recorded on the Client Application File as Adjusted Income Range (ADJINCRG).
Previously the income information was provided by the applicant, but recently the option for a one-time application has become available, with income data being provided directly from the Canada Revenue Agency.
Analysis
-
It is important to note that the income recorded on the DPIN application file is a "range", not an actual dollar value. The variable is coded as a number from -9 to 11, corresponding to adjusted income, increasing by $10,000 increments from - (negative) $90,000 to $100,000 and over. The following table shows the range for incomes $0 and above, (in 04/05 only 0.2% of records had values below $0):
Adjusted income $0.00 or greater
1 = $0 to 9,999.99
2 = $10,000.00 to $19,999.99
3 = $20,000.00 to $29,999.99
4 = $30,000.00 to $39,999.99
5 = $40,000.00 to $49,999.99
6 = $50,000.00 to $59,999.99
7 = $60,000.00 to $69,999.99
8 = $70,000.00 to $79,999.99
9 = $80,000.00 to $89,999.99
10= $90,000.00 to $99,999.99
11= $100,000.00 or more
DPIN Data
-
The resulting file generated from DPIN data contains a record for every application at each
Registration Number (REGNO) / (REGNO_CODE);
the year is recorded to keep the applications separate. A new Client Application File is received every year, so it is possible to continue the process into later years.
To assign a single value to each REGNO, the average value of ADINCRG from all of the annual Client applications is taken. Merging to a specific year would be preferable, but this is often impossible as there are gaps in the application history (there are REGNOs with no application in some years).
15.4% of REGNOs had only one application, and 40.5% had the same ADJINCRG value for one or more applications. Of those having multiple applications, 87.0% of REGNOs had ADJINCRG values which varied within a range of 3 or less.
Family Income
-
Since the Pharmacare application sums the income of both applicant and spouse, the income values represent family, or household, income. This makes it possible to assign household income based on family registration number (REGNO) to all family members, not just the DPIN applicants.
Family Characteristics
-
To attach Adjusted Income Range to REGNO, all Client Application Files from 1996/97 through 2007/08 were combined and the REGNO of each applicant was determined as of the date of the application.
-
On records with two applicants, 91.2% had the same REGNO, as would be expected for a married couple.
-
When REGNO agreed, the gender distribution was Male-Female for all but 25 of over 700,000 records. For the 8.8% where REGNO disagreed, Male-Female applicants still accounted for 99.1% of records.
-
48.2% of applications had two applicants. Among the remaining 51.8%, females outnumbered males as sole applicant (71.3% vs. 28.7%). [Demographic characteristics (age, marital status, etc.) of the sole applicants have not been investigated.]
-
Split families will have income attached for each of the REGNOs the children get assigned to.
- Blended families will have a single REGNO, the one that they combine to form (the 'originating' REGNOs for blended families are not used).
Representatives
-
The 205,036 applications in 2007/08 represented 217,248 distinct REGNOs. This allowed an ADJINCRG value to be assigned to 366,676 (30.9%) of the population enrolled in June 2007.
Because income data is captured at the date of the application, children in different birth cohorts have their family's income measured at different stages of life. For children born 1978 to 1985, it is measured at their late childhood/early adulthood, while children born 1996 to 2003 are measured around the time of their birth.
As more years of data accumulate it will be possible to assign income to more birth cohorts.
Estimating Average Family Income / Household Income Values With Adjustments for Inflation
-
This section describes a method for estimating the average DPIN family income / household income values with adjustments for inflation. To do this, we discuss the need to adjust incomes for inflation, and then describe a step-by-step process to estimate average family income / household income from the DPIN data that adjust these values for inflation.
A. Adjusting Incomes for Inflation
When working with income variables over time we need to work with constant dollars so we can make meaningful comparisons. We cannot compare income at time t, Mt, with income at time t1, Mt1, unless we have information about the prices at those points in time.
To be able to compare the income across time, we need to transform the income into "constant" dollars for a particular year, for example we want to express all income earned across time into year 1999 dollars. For this transformation we can use Consumer Price Index (CPI) information available from Statistics Canada.
The CPI is the ratio of the costs of a fixed basket of n goods evaluated with the prices at two different points in time, expressed as a percentage. It reflects how much the prices at time t1 (in the numerator) have changed relative to the prices at time t0 (in the denominator), expressed by the formula: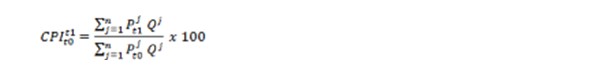
is the Consumer Price Index at time t1 relative to time t0 -- t0 is the base year, i.e. the constant t0 dollars. The CPI data is available from Statistics Canada at national, provincial and city levels. One can argue about using provincial CPI, because that is where people spend most of their money. We may be tempted to use Winnipeg CPI for people living in Winnipeg, but then we might worry about their mobility within the province. We can choose t0. It does not matter which t0 we choose.
We constructed a CPI table using several years of data from Statistics Canada publications that include values for Canada, Manitoba and Winnipeg. In addition, we added columns to the table that allow us to use two different base years: 1992 or 2002. The CPI table we constructed is available: MCHP - CPI Table From Statistics Canada Data - Excel Format.
Now we can transform all the incomes at times ti, M ti , into income values in terms of constant t0 dollars:The subscript indicates the base year t0, the superscript ti refers to the time when the income was earned. If all income variables M ti are transformed with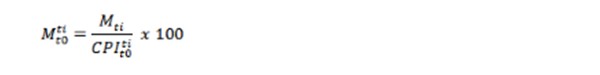
B. Estimating Average Family Income / Household Income
In order to estimate average family income / household income we follow three major steps:
Step 1: Calculating Annual Family Income / Household Income from DPIN Data
To calculate the annual family income / household income from the DPIN client application data, we start with a measure of the family income for the year based on the adjusted income range, and then add the dependency deduction to this. The family income measure is assigned using the income value corresponding to the "middle of the adjusted income range" from the Adjusted Income table presented above. For example, someone with the adjusted income range code value of 7 from the table will be assigned an income of $65,000 for the year, corresponding to the "middle" of the income range in the table. The "error" attached to this assignment is at most $5,000 for each family income.
In addition, we let TAXYR1 be the taxation year of the Canada Revenue Agency tax return form that supported the Pharmacare application. We assign TAXYR1 = TAXYRA1 (Taxation Year of Applicant 1) because TAXYRA1 is always present and agrees with TAXYRA2 (Taxation Year of Applicant 2) 99.5% of the time when both are present.
To calculate total family income / household income for the year, we must also add back in the dependency deduction that was subtracted from the original income amount. Given the number of dependents (DEPCOUNT) in the application file, we can reconstruct the family income for the taxation year TAXYR1. We do this by multiplying the fixed dependency credit of $3,000 by DEPCOUNT, and then adding this amount to the "Middle of the Adjusted Income Range" amount. Thus, family Income for taxation year TAXYR1 is calculated using the following formula:
Step 2: Adjusting for Inflation
Now we can adjust for inflation using the CPI index values from our CPI table described above. Family Income at time TAXYR1 (Family Income TAXYR1 ) will be transformed into constant dollars at time t0 using the following formula:
where
represents Family Income at time TAXYR1 in terms of constant (t0) dollars.
Step 3: Estimating Average Family Income / Household Income
We can then compute the average family income in terms of t0 dollars by summing the family income available and dividing by the number of years available, using the formula:
where TAXYRi are the taxation years the family used Pharmacare, and n is the number of application records for the family in the DPIN Client Application file. Now we can make more meaningful comparisons and analyses using Average Family Income, because it is expressed in constant t0 dollars.
Cautions and Limitations
-
The "Adjusted Income Range" code values of negative and zero, as well as the highest income level, represented by a code value of 11, deserve special attention and consideration on how they should be handled in these calculations. In the Birth Cohort data set (see the
Birth Cohort Registry - Methodology
concept for more information), these values represented about 4% of the data. Over time, negative "Adjusted Income Range" code values represent between 0.15 and 0.2 percent of the file.
-
There are different ways on how to deal with the first and last ranges of the "Adjusted Income Range". Here are some suggestions:
-
We can assign -$95,000 for Income Family Range -9, and $105,000 for Income Family Range 11 to be "consistent" with the $5,000 error. However, the error from choosing this "Middle of the Adjusted Income Range" for the first and last range will be larger than $5,000.
-
We could exclude the first and last ranges, with a caution to the user that this is a truncated sample. We need to caution the user anyway about sample-selection bias that comes from using this data. The sample in DPIN data is self-selected, raising the question of selection-bias from using such a sample. Those people with unusually high drug expenses relative to their income are selected. It can be either drug expenses are unusually high or that income is unusually low (which explains the negative categories, maybe due to floods, sickness of the main income earner in the family, bad crops). It can be that persistent bad medical conditions will cause a family to apply to Pharmacare in consecutive years. How many families are in such a situation?
- We could use dissemination area level information and average household income from the Census to get estimates of the family income for the census year. For more information on this please read the Income Quintiles - Child Health Income Quintiles concept for more information.
-
We can assign -$95,000 for Income Family Range -9, and $105,000 for Income Family Range 11 to be "consistent" with the $5,000 error. However, the error from choosing this "Middle of the Adjusted Income Range" for the first and last range will be larger than $5,000.
Related terms
- Drug Program Information Network (DPIN)
- Drug Program Information Network (DPIN) Data
- Household Income
- Household Income Value Ranges
- Registration Number (REGNO) / (REGNO_CODE)
Links
- Manitoba Health Web Site - Manitoba Pharmacare Program
- MCHP Data Repository - Drug Program Information Network (DPIN) Data Description
- Statistics Canada Web Site - 2001 Census Income Data - Catalogue No. 92-393-XIE
References
- Hammond J. Two sources of error in ecological correlations. American Sociological Review 1973;38:764-767.(View)
- Robinson W. Ecological correlations and the behavior of individuals. American Sociological Review 1950;15:351-357.(View)
- Roos LL, Walld R, Uhanova J, Bond R. Physician visits, hospitalizations, and socioeconomic status: ambulatory care sensitive conditions in a Canadian setting. Health Serv Res 2005;40(4):1167-1185. [Abstract] (View)
- Roos LL, Hiebert B, Manivong P, Edgerton J, Walld R, MacWilliam L, de Rocquigny J. What is most important: Social factors, health selection, and adolescent educational achievement. Social Indicators Research 2013;110(1):385-414. [Abstract] (View)
Keywords
- census
- health status
- socioeconomic status
Request information in an accessible format
If you require access to our resources in a different format, please contact us:
- by phone at 204-789-3819
- by email at info@cpe.umanitoba.ca
We strive to provide accommodations upon request in a reasonable timeframe.
Contact us
Manitoba Centre for Health Policy
Rady Faculty of Health Sciences,
Room 408-727 McDermot Ave.
University of Manitoba
Winnipeg, MB R3E 3P5 Canada