MAP PROJECTIONS
|
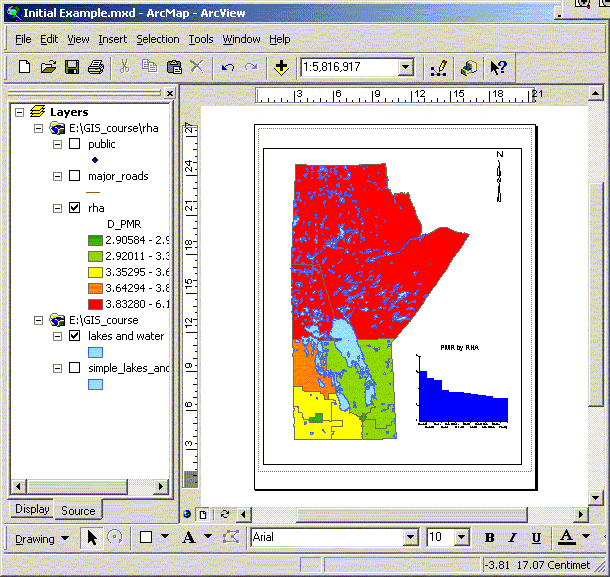
Projections Open the RHA map file that was saved before the last activity. In our View, Manitoba looks expanded at the top. This is because decimal degrees are used as if they are in Cartesian space (simple X/Y co-ordinates). However, the actual distances between lines of longitude get smaller as the latitude increases. When the map is flattened, the top (often near the North Pole) expands. This is a typical problem with trying to represent a globe on a flat surface.
Projections are used to fix this problem. Most of the data at MCHP is stored in decimal degrees and needs to be projected. Some data that you obtain will be projected already – e.g. the conversion has been made already and the underlying data is saved in projected units (e.g. meters). Generally decimal degrees provide a wider range of options but there are problems when trying to measure some scales, distances, bearings, or areas, trying to change projections, sharing your data with other people or software applications. Most simple mapping applications such as EpiMap do not have the ability to re-project data and will only display geographic files as they are provided. When projecting a map there are a wide range of things to consider.
I will not go into all of the subtleties during this course suffice
to say that if you want Manitoba to look normal it must be projected.
If you are interested in further information see the following WWW
sites: http://www.gis.psu.edu/projection/
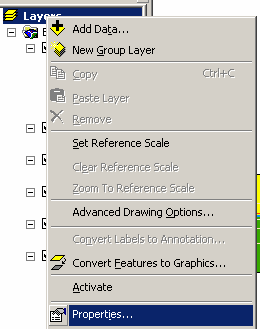
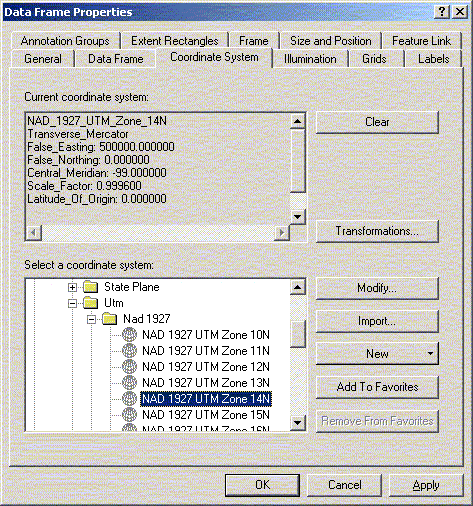
or To set the projection for your map, go to the frame properties
and look under the Coordinate System tab. Under the coordinate system
select
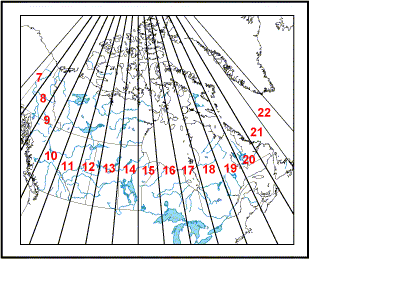
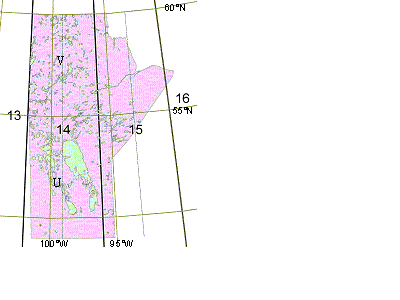
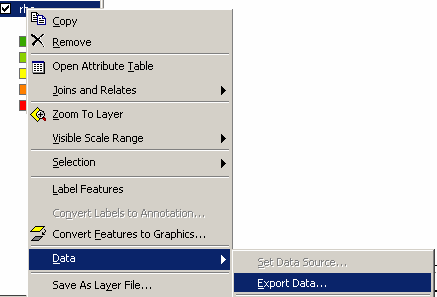
The usual projection used for Manitoba is UTM Zone 14 (NAD 83 or 27), although there are others. Manitoba does cross three zones (14, 15, 16) so the east, and especially the north east of the province will have more distortion, but zone 14 gives a reasonable approximation across most of the province and is suitable for our needs. If you plan on doing large distance/bearing calculations in the east/north east of the province you may want to consider another projection. Which projection you use will depend on your data needs and data source. Make sure you know the datum that was used to create the data. This is a question to ask if someone is providing any map data. ArcGIS can use data projected in multiple formats, ArcGIS will allow you to use different projections at the same time and as long as they are based on the same datum they should line up correctly. After you have projected your map, remember to change the map units to meters under the general tab (this should be set since meters is the unit for UTMs) and the Distance measure to kilometres or what ever measurement you prefer for distances. Your map should now look more like the familiar shape of Manitoba. The issue of projections and projected data usually arises when you get data and you don’t know the units or projection that it was saved in. For example, most of our data uses decimal degrees projected into UTM but many groups use data stored as meters already projected in UTM. Convert one of the projected themes in the current project to a new shape file. Only the selected features in the theme will be saved into the new shape file. Note that ArcGIS will ask if you want to save in original format (decimal degrees) or projected units. Typically you will want to save in decimal degrees. There are times when you want to calculate distance or areas in a specific way, or export the geographic file to another application (e.g. MS Map or EpiMap) in these cases you will need to save the shape file in projected units. When adding imported data to your view, you may run into a problem in which not all parts of your map line up. This could be because some of your data is already projected, while some of it is still in decimal degrees or the two data sources were generated using different datums. While ArcGIS will allow you to combine in one data view multiple projections, sometimes the projection is not known and there will be problems. If you know the projection information it can be added through the use of ArcToolbox. If there is a mismatch you typically can only ‘see’ one theme or another. The other problem with different datums is more difficult to see (and correct). The difference between the North American Datum (NAD 83) and NAD 27 for Manitoba is small and generally will not be noticed when working at the provincial level. This is not true when working at a small area (e.g. Winnipeg) level. If you want to convert the data from one projection to another you will need to use the Projection Utility supplied with ArcGIS and available through ArcToolbox. The Health Regions provided by Health Canada (next example) is an example of a file that has been saved in a projected format. After you have imported the ArcInfo file try to add the file to one of your existing views. Both should line up correctly since ArcInfo files store the projection information with the data.
|
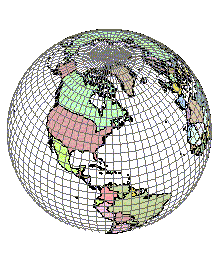 Earth as a Sphere
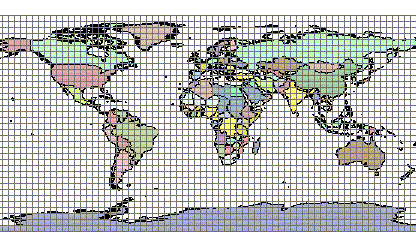 Cylindrical Projection or Plate Carrée