BASIC USE: TABLES AND CHARTS
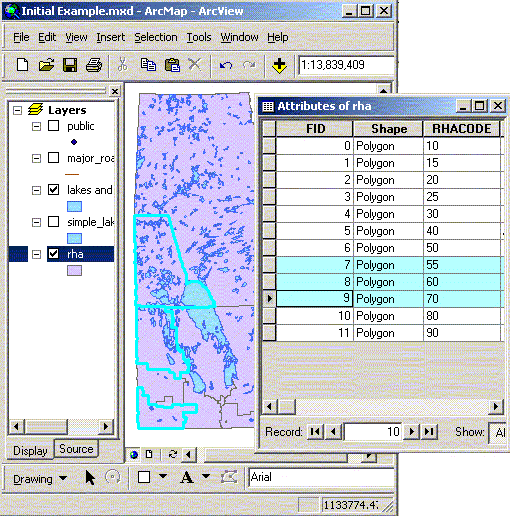
| Tables Every layer in ArcGIS has an associated attribute table. To view these tables select “Open Attribute Table” from the context menu for the layer in the table of contents. Attribute tables are the actual dbf (dbase IV) files associated with each shape file. When supporting tables are joined to an attribute table it only applies to the associated layer even when you have included the same shape file multiple times. Select the RHA theme and select “Open Attribute Table”. You will notice that now, when you select parts of your theme, they will be highlighted on the theme table as well. If you select parts of the attribute table the corresponding features in the theme will be selected. Standalone tables can also be added as Dbase IV (dbf), MS Access, delimited text (txt) files. In general you will only add these tables if they have a field that can be joined to an existing theme attribute file. Adding your own data will be covered later in the workshop. When importing text files you may have to create or edit a ‘schema.ini’ file that identifies the contents, layout, and delimiters of the file. ArcGIS will generate a schema file in every directory with a file it might be able to read. This file will be filled with a guess at the format. Example of the schema file in the RHA directory.
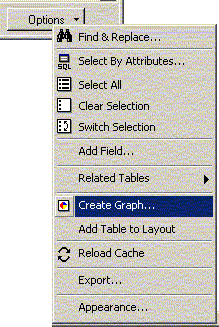
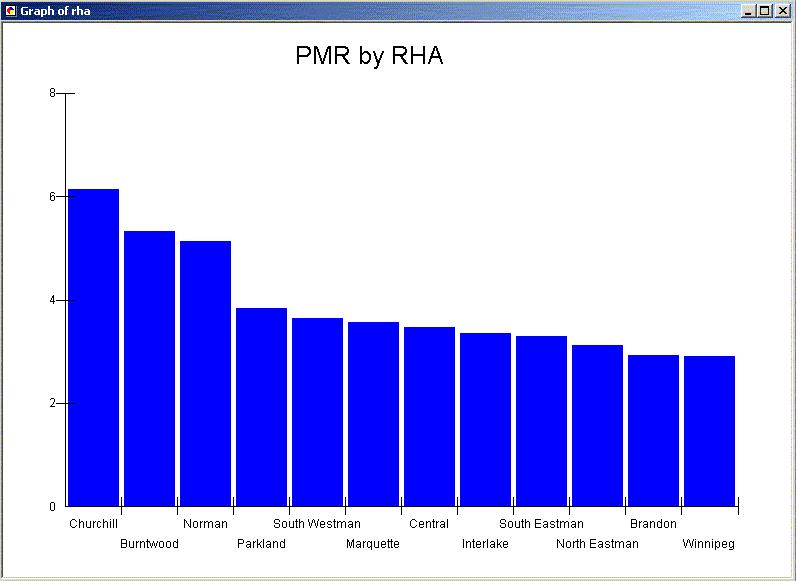
Attribute tables associated with shape files can be opened outside of ArcGIS. Try opening the dbf file associated with the RHA shape file (or theme). Open Excel then open the file D:\GIS_course\rha\rha.dbf. Remember each shape file has several other files associated with it. DBF files are an example of one of these. You can edit and change the dbf file without using ArcGIS. Be careful not to change the number of records or ArcGIS may stop reading the shape file. If you change the dbf file while ArcGIS is running (this is generally a bad idea) you may have to close and re-open the project. Charts ArcGIS has a limited set of charts (bar, histograms, pie, etc…) that can be created from tables for presentation purposes. If you are interested in creating more complex charts the data should be exported into a package that does charting and graphing. To generate a chart open the appropriate attribute table (e.g. the rha attribute table) then select “Create Graph”. The graph can be viewed on the screen or added to the layout view (below).
|